How to Read a Crypto Chart and Understand the Market
A beginner-friendly guide to reading crypto charts - candlesticks, timeframes, volume, trend, support and resistance, and why market cap and FDV matter more than price per coin. Chart literacy for understanding, not trading.
The short answer
Reading a crypto chart isn't about predicting the future, it's about understanding what you're looking at so you're not flying blind. The basics you need:
- Price chart + timeframe: the line or candles showing an asset's price over a chosen period (an hour, a day, a year).
- Candlesticks: each "candle" shows the open, high, low, and close for a period, green (up) or red (down).
- Volume: how much was traded, a measure of activity and conviction behind a move.
- Market cap (and FDV): the asset's total value, which matters far more than its price per coin.
This guide teaches you to read a chart and understand market metrics, not to trade on them. Charts show the past, not the future, and no pattern is a crystal ball. Used well, chart literacy helps you understand what's happening and ask better questions; used badly, it fuels over-trading and FOMO. Here's how to read one properly.
Note: This is general educational information to help you understand charts, not trading advice, signals, or a strategy, and not a recommendation to buy or sell anything. Technical analysis is not a reliable predictor of future prices. For personal financial advice, see an ASIC-licensed adviser.
What you'll need
- Access to a charting tool (most exchanges and data sites like CoinGecko have them).
- An asset to look at and a little patience to get familiar with the layout.
- A healthy scepticism, remember you're learning to read the market, not predict it.
What you're actually looking at
A crypto price chart plots an asset's price (vertical axis) over time (horizontal axis). The first thing to set is the timeframe, the period each data point represents and how far back you're looking:
- Short timeframes (minutes, hours) show recent, noisy movement, used by traders.
- Long timeframes (weeks, months, years) show the bigger picture and longer trends, far more useful for investors.
A common beginner trap is staring at short timeframes and reacting to every wiggle. Zooming out to longer timeframes gives perspective and reduces emotional reactions. As a long-term-minded investor, the daily and weekly views tell you more than the one-minute chart ever will.
How to read a candlestick
Most crypto charts use candlesticks, and once you can read one, charts make far more sense. Each candle represents one period (say, one day) and shows four prices:
- Open, the price at the start of the period.
- Close, the price at the end.
- High, the highest point reached.
- Low, the lowest point.
The body of the candle spans the open and close; the thin wicks (or shadows) above and below reach to the high and low. Colour shows direction: typically green (or white) means the price closed higher than it opened, and red (or black) means it closed lower.
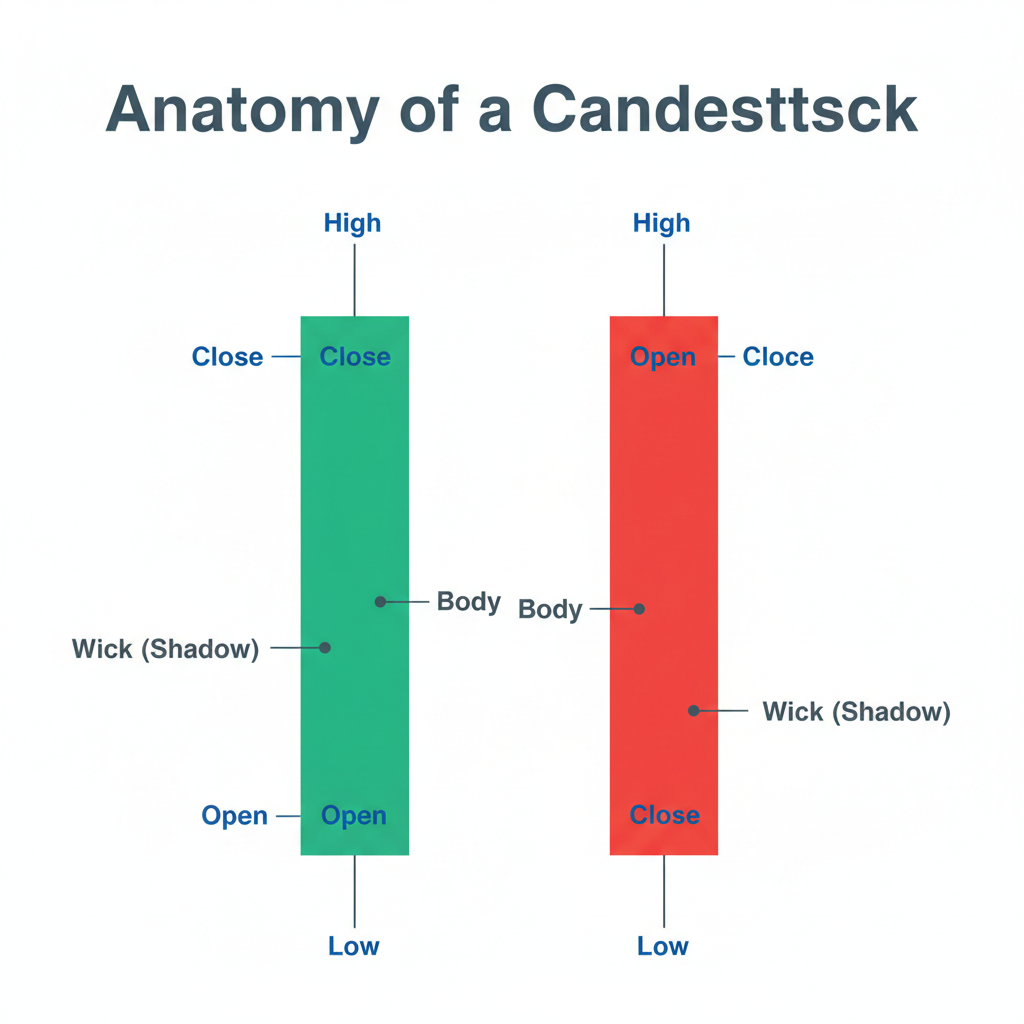
| Part of the candle | What it tells you |
|---|---|
| Body | The range between open and close |
| Wicks (shadows) | The highest and lowest prices reached |
| Green / up candle | Closed higher than it opened |
| Red / down candle | Closed lower than it opened |
| Long body | Strong move in one direction |
| Long wick | Price was pushed there but rejected |
Reading a sequence of candles shows you how price moved and how decisively, but remember, it's a record of what happened, not a prediction of what's next.
The other things a chart shows
Volume
Below the price, most charts show volume, how much of the asset was traded in each period, usually as bars. Volume is a measure of activity and conviction: a price move on high volume reflects more participation than the same move on thin volume. It's context for price, not a signal on its own.
Trend
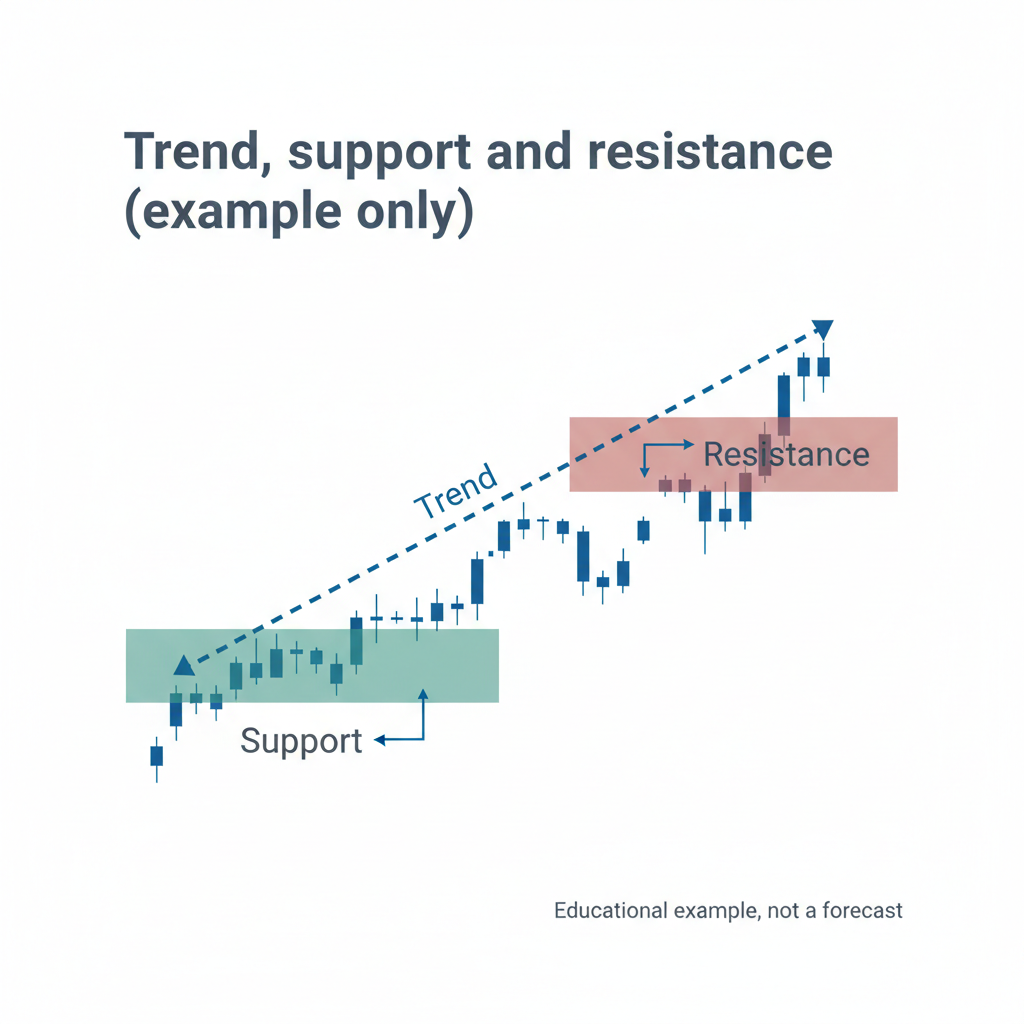
Step back and a chart usually shows one of three things: an uptrend (rising over time), a downtrend (falling), or a sideways/ranging market (moving within a band). Identifying the broad trend is more useful than obsessing over individual candles. Crypto also moves in longer market cycles of booms and busts, our guide on crypto market cycles covers this bigger picture.
Support and resistance (the basics)
You'll hear about support (a price level where buying has tended to halt falls) and resistance (a level where selling has tended to cap rises). These are simply zones where price has reacted before. They're useful for understanding where attention sits, but they're rough observations, not guarantees, and they break regularly. Treat them as context, not rules.
Beyond price: the metrics that matter more
Price per coin is the number beginners fixate on, but on its own it's almost meaningless. More important:
- Market capitalisation (market cap): the asset's total value, roughly price times circulating supply. A coin priced at a few cents can be worth far more in total than one priced at thousands of dollars, depending on supply. Always look at market cap, not just price per coin.
- Fully diluted valuation (FDV): what the market cap would be if all the supply were in circulation. A big gap between market cap and FDV signals future supply (dilution) to come, crucial context. (Our guide on market cap vs FDV explains this.)
- Trading volume: liquidity and activity, can you actually buy and sell at a fair price?
- Dominance: how much of the total crypto market a given asset represents, a sense of relative scale.
Understanding these stops you from making the classic mistake of thinking a "cheap" coin (low price per unit) is automatically a bargain. It isn't, supply and total value are what matter.
A crucial caveat: charts show the past, not the future
This deserves its own section because it's where people go wrong. A chart is a record of what has already happened. Patterns, trends, and support levels describe history; they do not reliably predict the future. Technical analysis is widely used, but it is not a crystal ball, markets routinely break "obvious" patterns, and no chart can tell you what an asset will do next.
Used well, chart literacy helps you understand context, see the bigger picture (especially on longer timeframes), and ask better questions. Used badly, it fuels over-trading (reacting to every move), FOMO (chasing green candles), and panic (selling on red ones). For most investors, the value of reading charts is understanding, not timing, and the longer-term view is far more useful than the minute-to-minute noise. Be especially wary of anyone using charts to make confident price predictions or sell "signals."
A quick glossary
| Term | Plain meaning |
|---|---|
| Candlestick | A bar showing open, high, low, close for a period |
| Timeframe | The period each candle covers / how far back you're viewing |
| Volume | How much was traded, activity and conviction |
| Trend | The general direction: up, down, or sideways |
| Support | A level where falls have tended to slow |
| Resistance | A level where rises have tended to stall |
| Market cap | Total value of an asset (price times circulating supply) |
| FDV | Total value if all supply were circulating |
| Liquidity | How easily you can buy/sell at a fair price |
How to approach a chart as a long-term investor
If you're investing for the long term rather than trading, the way you use a chart is different, and simpler. Rather than hunting for short-term signals, you're using the chart for context: where does this asset sit in the bigger picture? A sensible approach looks like this:
- Open the chart.
- Zoom out to a long timeframe (daily or weekly).
- Identify the broad trend (up, down, or sideways).
- Check market cap and FDV, not just price per coin.
- Use it as context, not a prediction.
Notice what's not there: no minute-by-minute watching, no chasing candles, no acting on "signals." For a long-term investor, the chart is one input for understanding, the fundamentals of the asset, sensible position sizing, and a clear plan matter far more than any pattern on the screen. If you find a chart making you feel you must act right now, that's usually a sign to step back rather than trade.
Common mistakes reading charts
- Fixating on price per coin instead of market cap and total value.
- Staring at short timeframes and reacting to every wiggle.
- Treating chart patterns as predictions rather than history.
- Chasing green candles (FOMO) or panic-selling red ones.
- Trusting "signals" and confident price calls built on technical analysis.
- Ignoring volume and liquidity.
- Overlooking FDV and future supply (dilution).
- Over-trading because a chart makes you feel you must act.
Frequently asked questions
How do I read a crypto candlestick chart?
Each candlestick represents one period and shows four prices: the open (start), close (end), high, and low. The candle's body spans the open and close, while the thin wicks above and below reach to the high and low. Colour shows direction, typically green means it closed higher than it opened, red means lower. A long body suggests a strong move; a long wick suggests price was pushed somewhere then rejected. Reading a sequence of candles shows how price moved and how decisively, but it records what happened, it doesn't predict what's next.
What's the difference between price and market cap?
Price is the cost of one unit of a crypto; market cap is its total value, roughly price multiplied by the circulating supply. Market cap matters far more, because price per coin is meaningless without knowing how many coins exist. A coin priced at a few cents can have a larger total value than one priced at thousands of dollars, depending on supply. This is why a "cheap"-looking coin isn't automatically a bargain, always look at market cap, and ideally fully diluted valuation, rather than fixating on the price per unit.
Can chart patterns predict where the price is going?
No, not reliably. Chart patterns and technical analysis describe what has already happened and where attention has sat; they cannot reliably predict the future, and markets routinely break "obvious" patterns. Technical analysis is widely used and can help you understand context and trends, but treating it as a crystal ball leads to costly mistakes. Be especially sceptical of anyone using charts to make confident price predictions or to sell trading "signals." For most investors, charts are best used for understanding the market, not for trying to time it.
What timeframe should I look at?
For a long-term-minded investor, longer timeframes, daily, weekly, monthly, are far more useful than short ones, because they show the bigger picture and the broad trend while filtering out short-term noise. Short timeframes (minutes, hours) are noisy and tend to provoke emotional, reactive decisions. A common beginner mistake is staring at very short charts and reacting to every wiggle. Zooming out gives perspective and reduces the temptation to over-trade. Match the timeframe to your actual horizon: if you're investing for years, the minute chart tells you little.
What does trading volume tell me?
Volume shows how much of an asset was traded in a period, a measure of activity and the conviction behind a price move. A move on high volume reflects broader participation than the same move on thin volume, so volume is useful context for price. It also relates to liquidity: higher volume generally means you can buy and sell more easily at a fair price. Volume isn't a signal on its own, and shouldn't be used to predict prices, but it helps you interpret what a price move means and how tradeable an asset is.
What are support and resistance?
Support is a price level where buying has tended to slow or halt falls in the past; resistance is a level where selling has tended to cap rises. They're simply zones where price has reacted before, so they give a sense of where market attention sits. However, they're rough observations rather than rules, price breaks through them regularly, and they shouldn't be treated as guarantees or used to make confident predictions. Think of them as context that helps you understand a chart, not as reliable signals to act on.
Do I need to read charts to invest in crypto?
Not necessarily for long-term investing. Understanding charts and market metrics (especially market cap and FDV) helps you make sense of what's happening and avoid basic errors, which is worthwhile. But you don't need to become a technical analyst, and for long-term investors, obsessing over charts often does more harm than good by encouraging over-trading and emotional decisions. Understanding the fundamentals of an asset, sizing your position sensibly, and having a plan matter more than chart-reading. Use charts for context and literacy, not as the basis of your strategy.
Why shouldn't I just buy when the chart is green and sell when it's red?
Because that's reacting to price moves emotionally rather than investing with a plan, and it's a reliable way to buy high (chasing green candles in FOMO) and sell low (panicking on red ones), the opposite of what you want. A green or red candle tells you what price did, not what it will do next. Charts show history, not the future, so using candle colour as a buy/sell trigger has no predictive basis. A considered plan based on your goals and research serves you far better than reacting to the colour of the latest candle. Our guide on buy/hold/sell decisions explores this.
Is technical analysis worth learning as a beginner?
A basic understanding of how to read charts, candlesticks, timeframes, volume, and especially market cap versus price per coin, is genuinely useful and worth learning, because it helps you make sense of what's happening and avoid simple errors. Going deeper into technical analysis as a prediction tool is far less valuable for most beginners, and can encourage over-trading and false confidence, since chart patterns don't reliably predict prices. Focus first on chart literacy for understanding, plus the fundamentals of investing, sizing, research, and a plan. Treat advanced technical analysis with caution, not as a path to predicting the market.
Trying to make sense of the market and where your holdings stand within it? Get an independent, expert review of your crypto portfolio, no token holdings, no conflicts, just clarity. Book a free portfolio review call.
Next in the how-to hub
Next in the how-to hub: put it all together with our beginner's roadmap for starting in crypto the right way.
Explore all how-to guides

Mario Stanic · Founder, Crypto Research Australia
Founder of Crypto Research Australia and a self-taught algorithmic trading expert with a proven track record executing multi-billion-dollar trading volume across futures and spot markets. Featured as a crypto expert and market analyst in the Sydney Morning Herald, The Age, the Australian Financial Review, and Channel 9.
Thanks for reading. Take it from the top, or keep exploring our research.